Finowfurt - Tagesverlauf für den 16.08.2021
Die zurückliegende, stündliche Entwicklung aller uns zur Verfügung stehenden sowie selbst berechneten Parameter in der Übersicht. Aufgrund der Menge an Daten haben wir die Seite in drei Teile aufgesplittet:
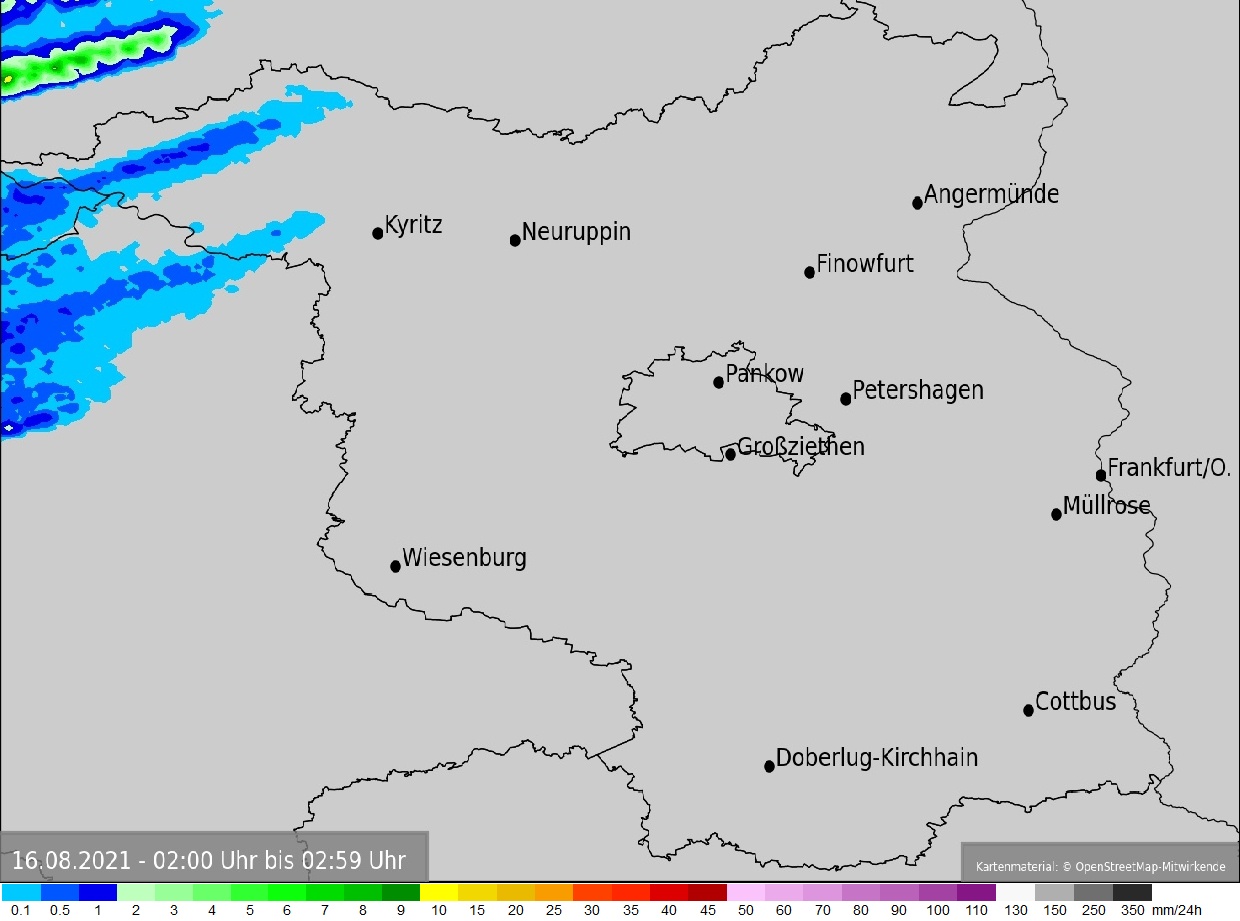
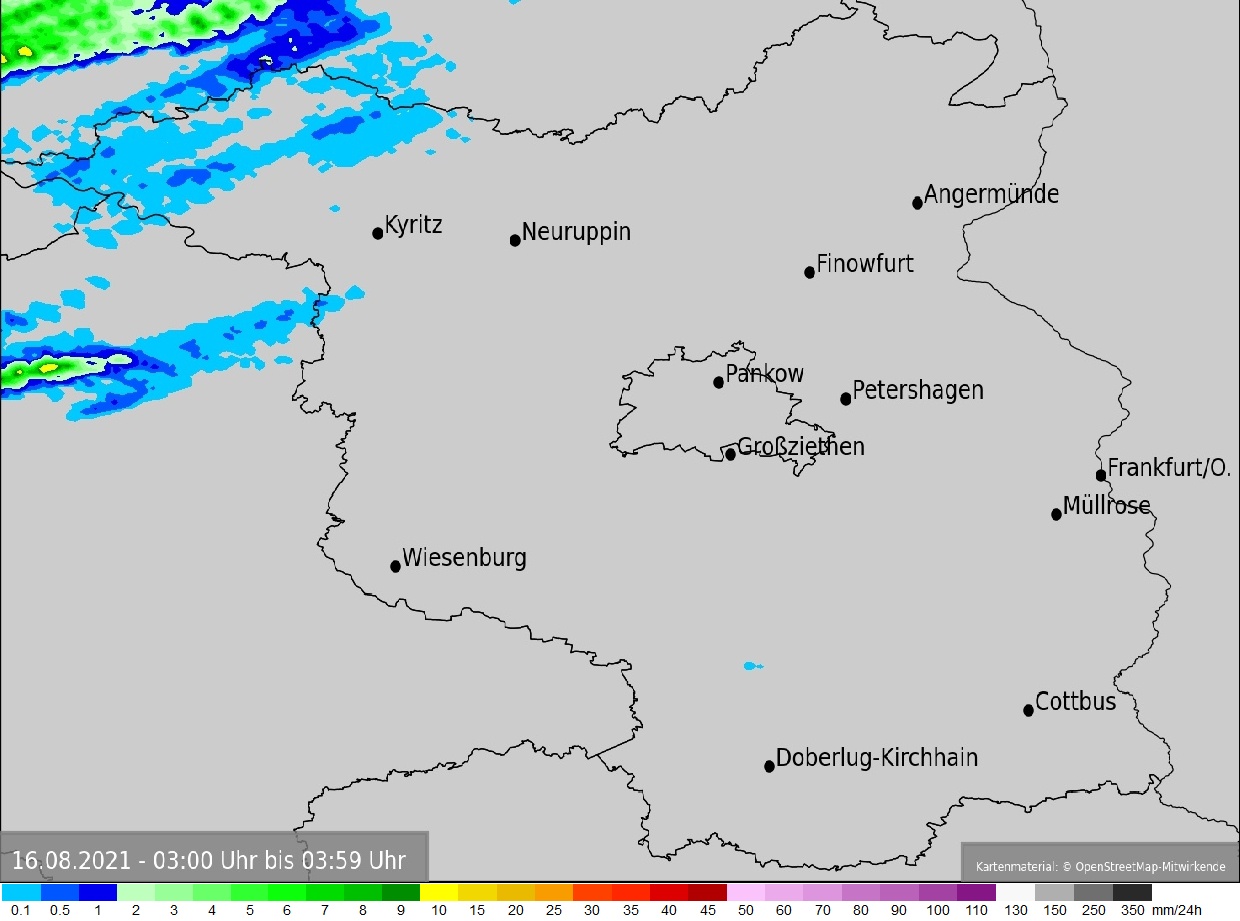
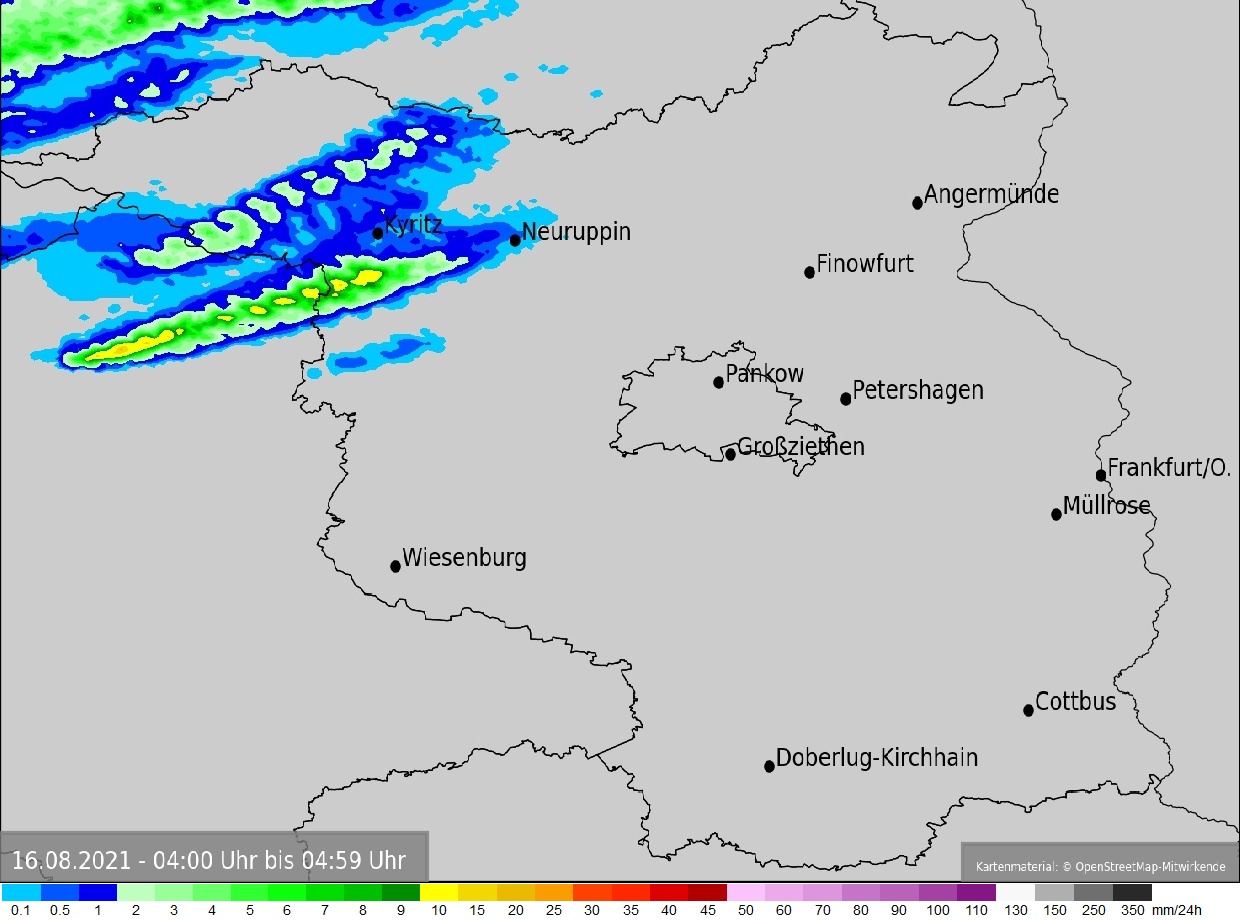
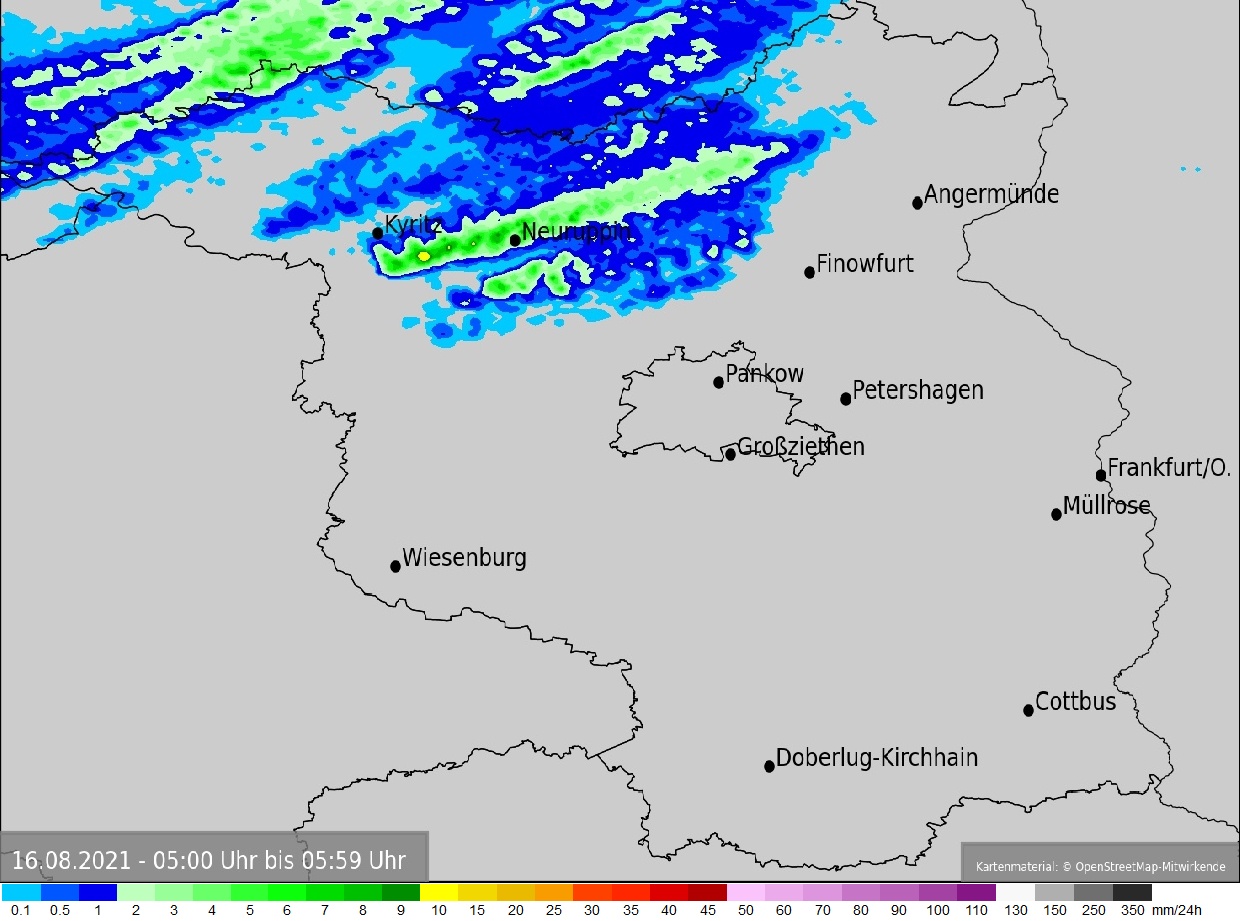
Im oberen Bereich finden Sie die Diagramme, Zeitrafferaufnahmen und Radar- und Satellitenfilme. Im mittleren Teil der Seite sind sämtliche Messwerte sowie die berechnete Wetterlage zu finden. Der letzte Block enthält die selbst berechneten Warnindizes.
Legende:  = Diagramme,
  = Zeitraffer vorhanden, = Kein Zeitraffer vorhanden, RD = Radarfilm Deutschland, RB = Radarfilm Berlin-Brandenburg, RL = Radarfilm Landkreis, SE = Satellitenfilm Europa, IE = Isobarenfilm Europa
Finowfurt - Messwerte vom 16.08.2021
| Stunde → | 00 | 01 | 02 | 03 | 04 | 05 | 06 | 07 | 08 | 09 | 10 | 11 | 12 | 13 | 14 | 15 | 16 | 17 | 18 | 19 | 20 | 21 | 22 | 23 |
|---|---|---|---|---|---|---|---|---|---|---|---|---|---|---|---|---|---|---|---|---|---|---|---|---|
| Webcam |  |
 |
 |
 |
 |
 |
 |
 |
 |
 |
 |
 |
 |
 |
 |
 |
 |
 |
 |
 |
 |
 |
 |
 |
| Wetter |  |
|
|
|
|
 |
 |
 |
 |
|
 |
 |
|
|
|
 |
|
 |
 |
 |
 |
 |
|
|
| Temperatur in °C |
15.9 | 15.1 | 14.3 | 13.6 | 13.6 | 13.3 | 13.0 | 14.6 | 16.3 | 19.2 | 21.0 | 21.7 | 21.4 | 21.3 | 22.9 | 22.4 | 22.2 | 22.1 | 17.3 | 14.6 | 14.0 | 13.5 | 12.6 | 12.6 |
| Gef. Temp. in °C |
15.9 | 15.1 | 14.3 | 13.6 | 13.6 | 13.3 | 8.6 | 14.6 | 16.3 | 19.2 | 21.0 | 19.1 | 18.5 | 19.3 | 22.4 | 22.4 | 19.8 | 20.9 | 13.7 | 14.6 | 14.0 | 13.3 | 12.2 | 12.6 |
| Luftfeuchte in % |
88 | 90 | 92 | 93 | 94 | 94 | 94 | 93 | 92 | 84 | 75 | 70 | 61 | 63 | 60 | 59 | 56 | 56 | 83 | 87 | 91 | 92 | 92 | 93 |
| Luftdruck in hPa |
1009.1 | 1008.5 | 1008.0 | 1007.5 | 1006.5 | 1006.0 | 1006.1 | 1005.7 | 1005.9 | 1006.0 | 1005.7 | 1006.0 | 1006.4 | 1006.4 | 1006.1 | 1005.9 | 1005.8 | 1005.9 | 1007.3 | 1008.2 | 1008.4 | 1009.1 | 1009.4 | 1009.3 |
| Niederschlag in mm |
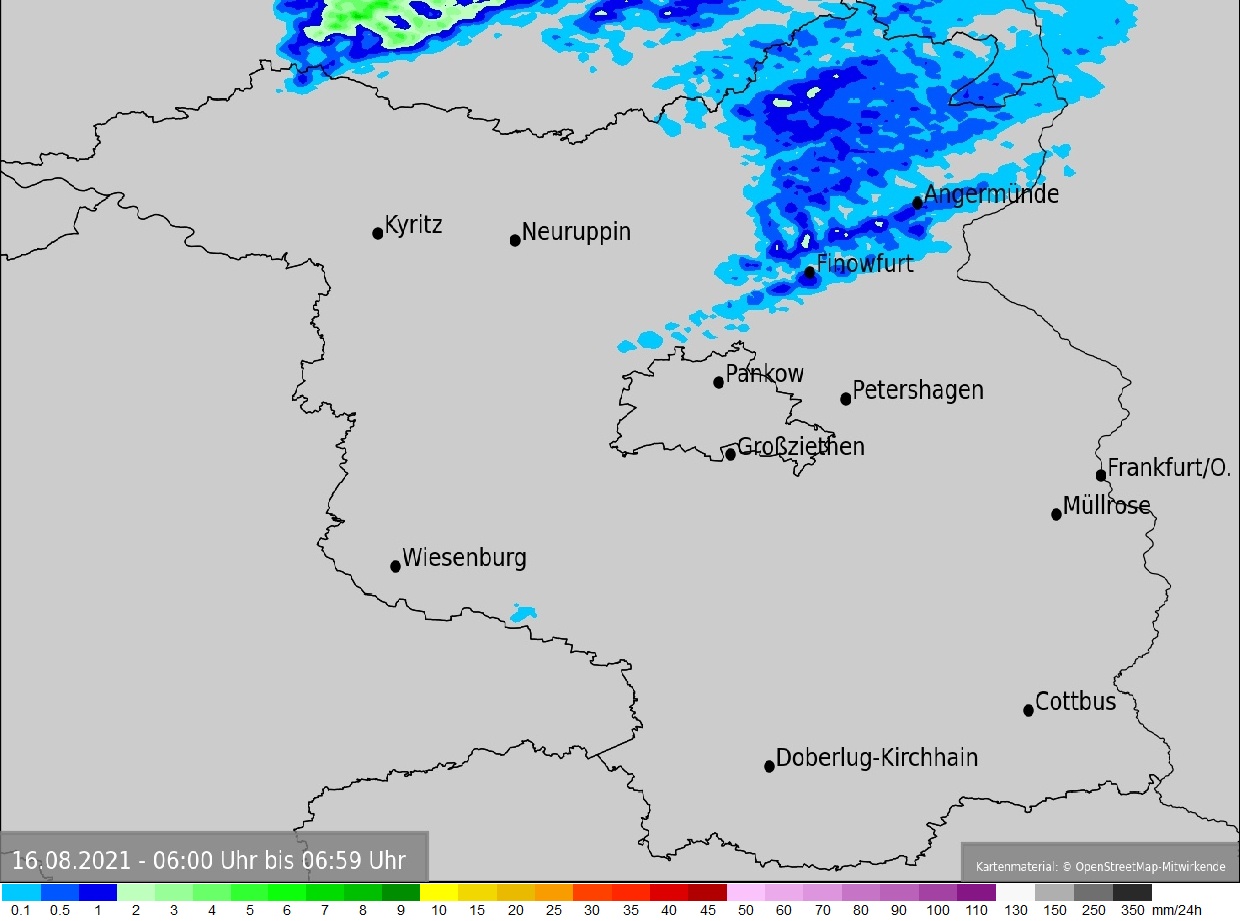
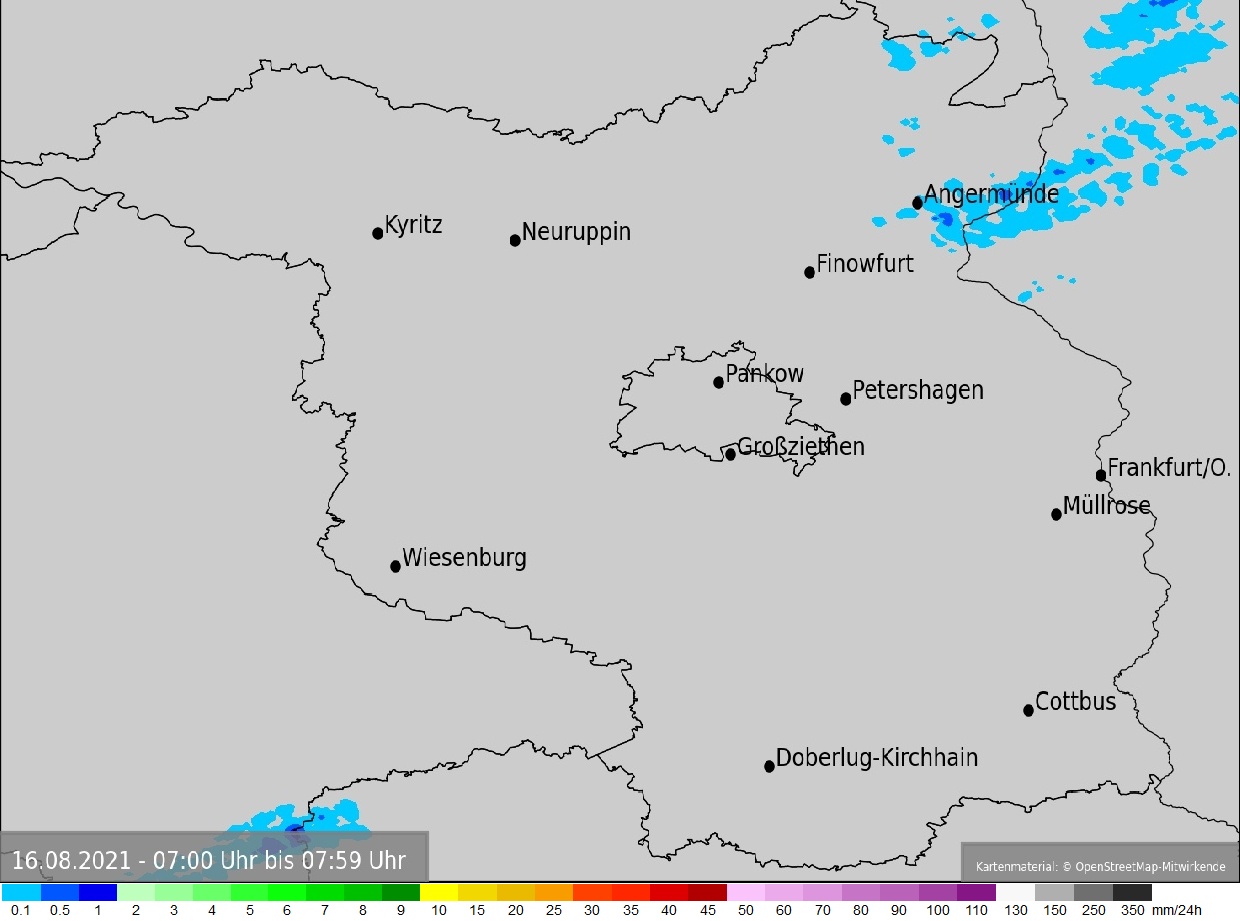
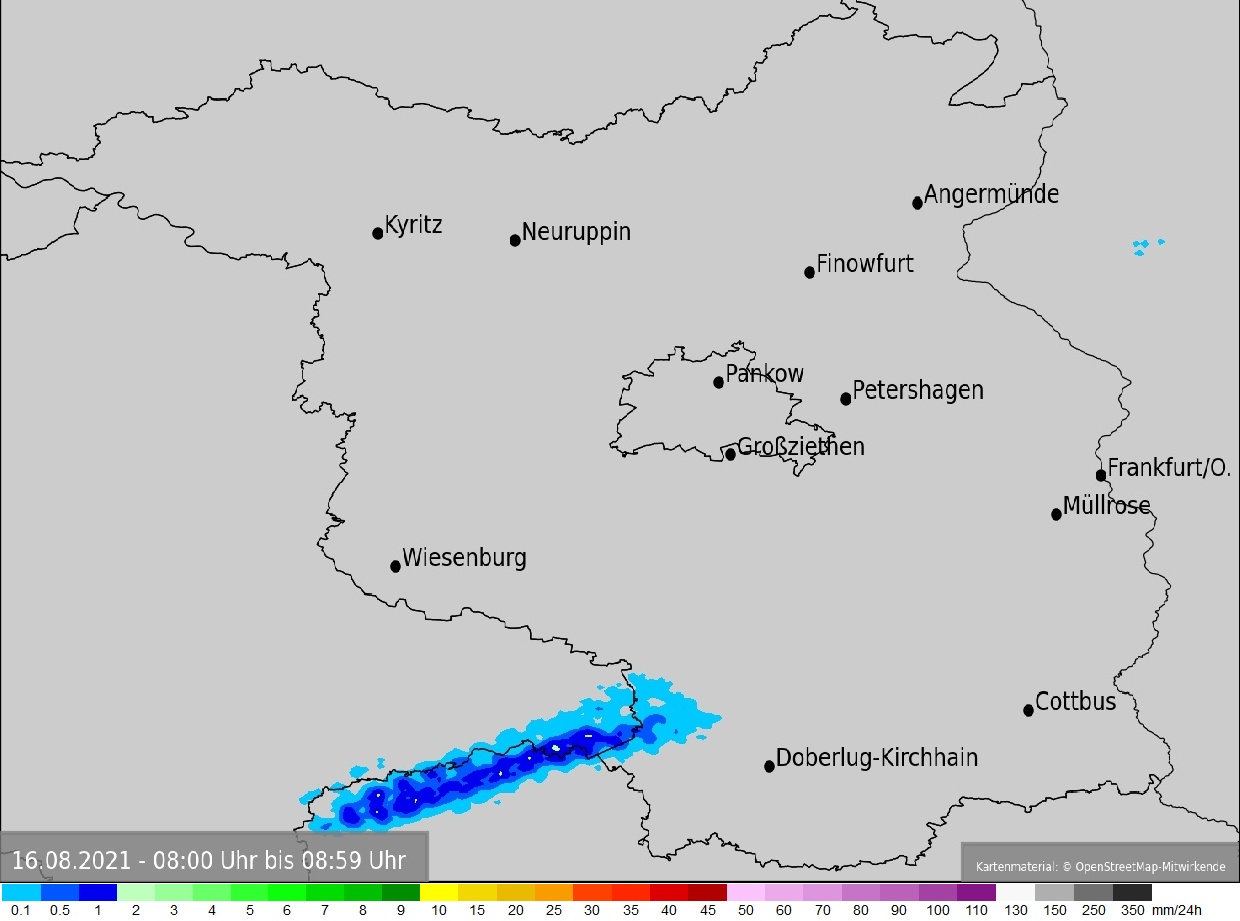
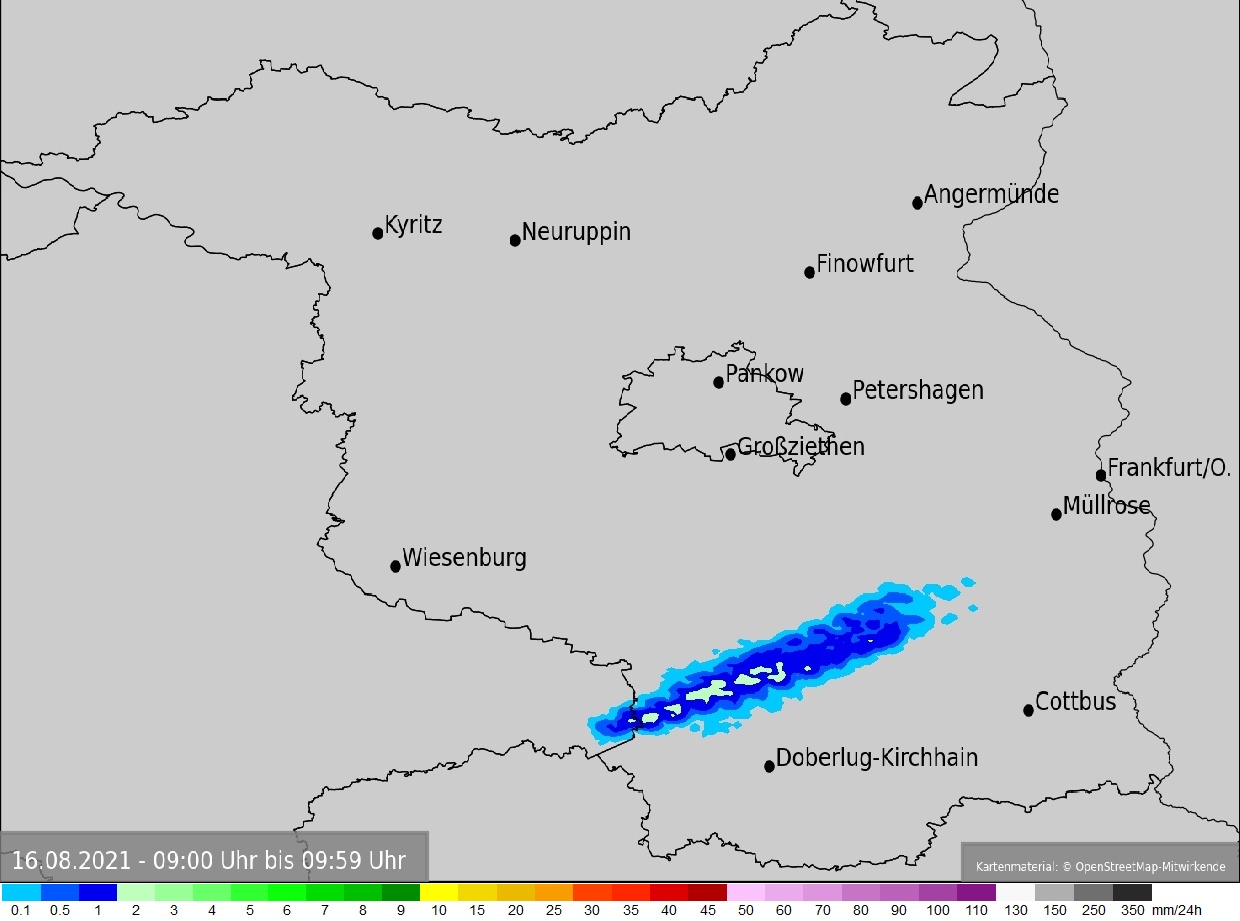
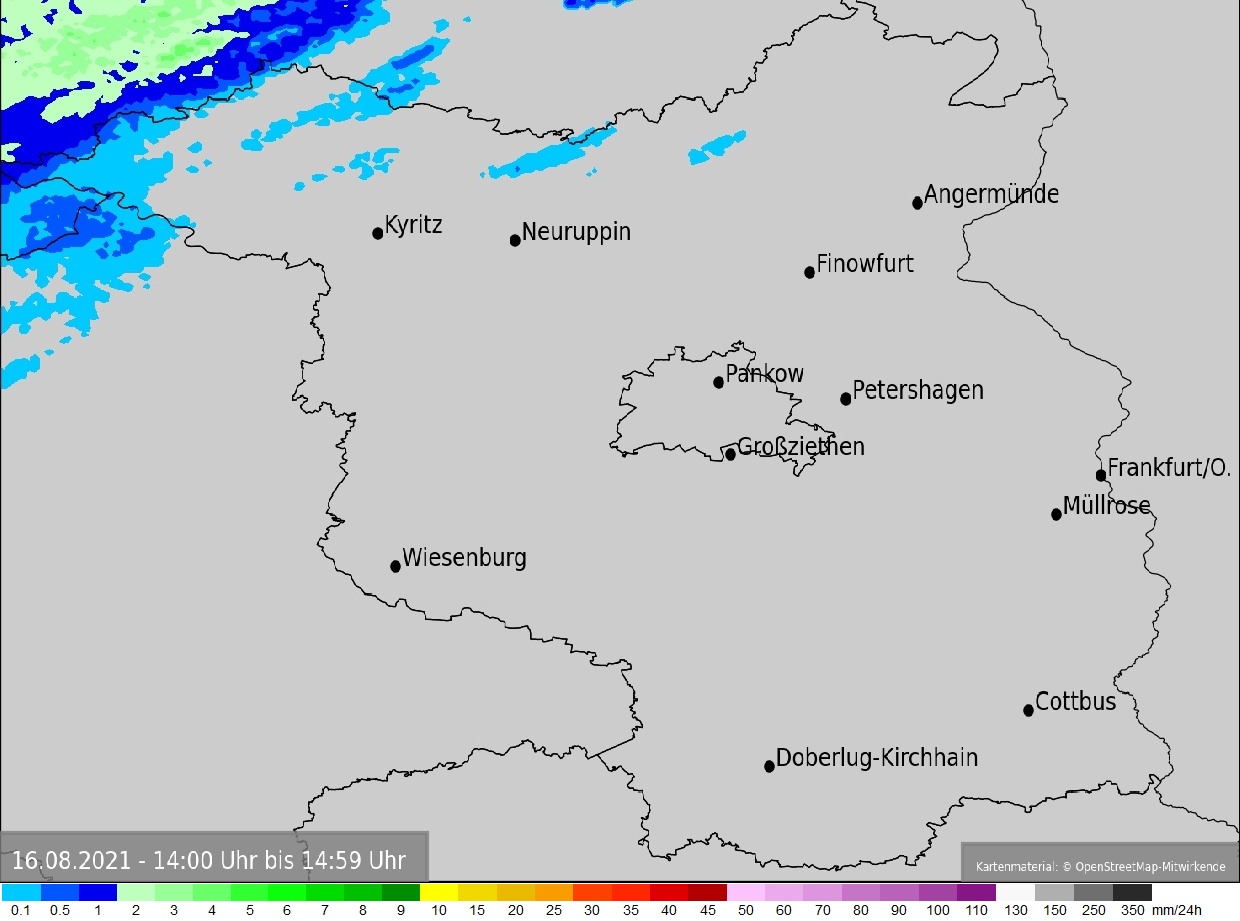
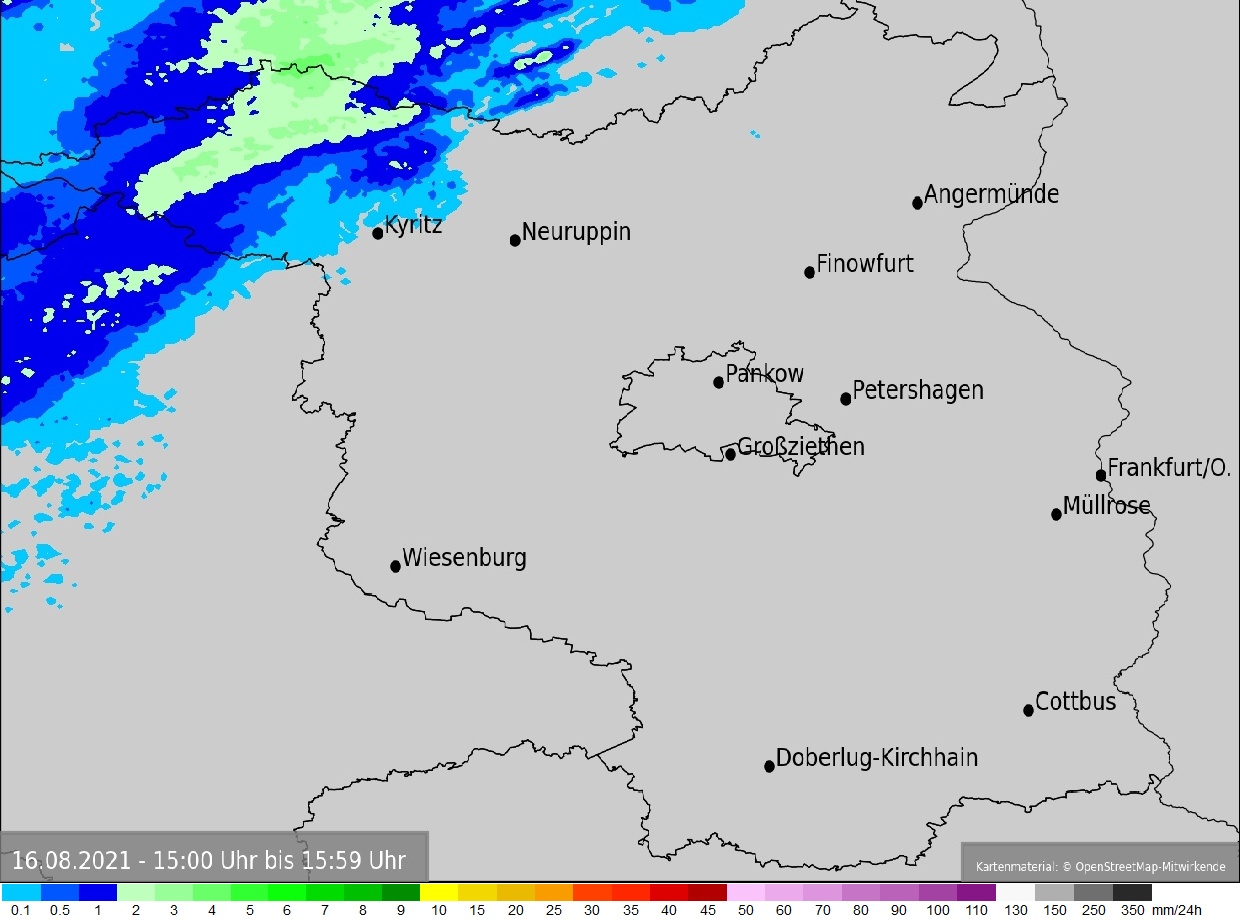
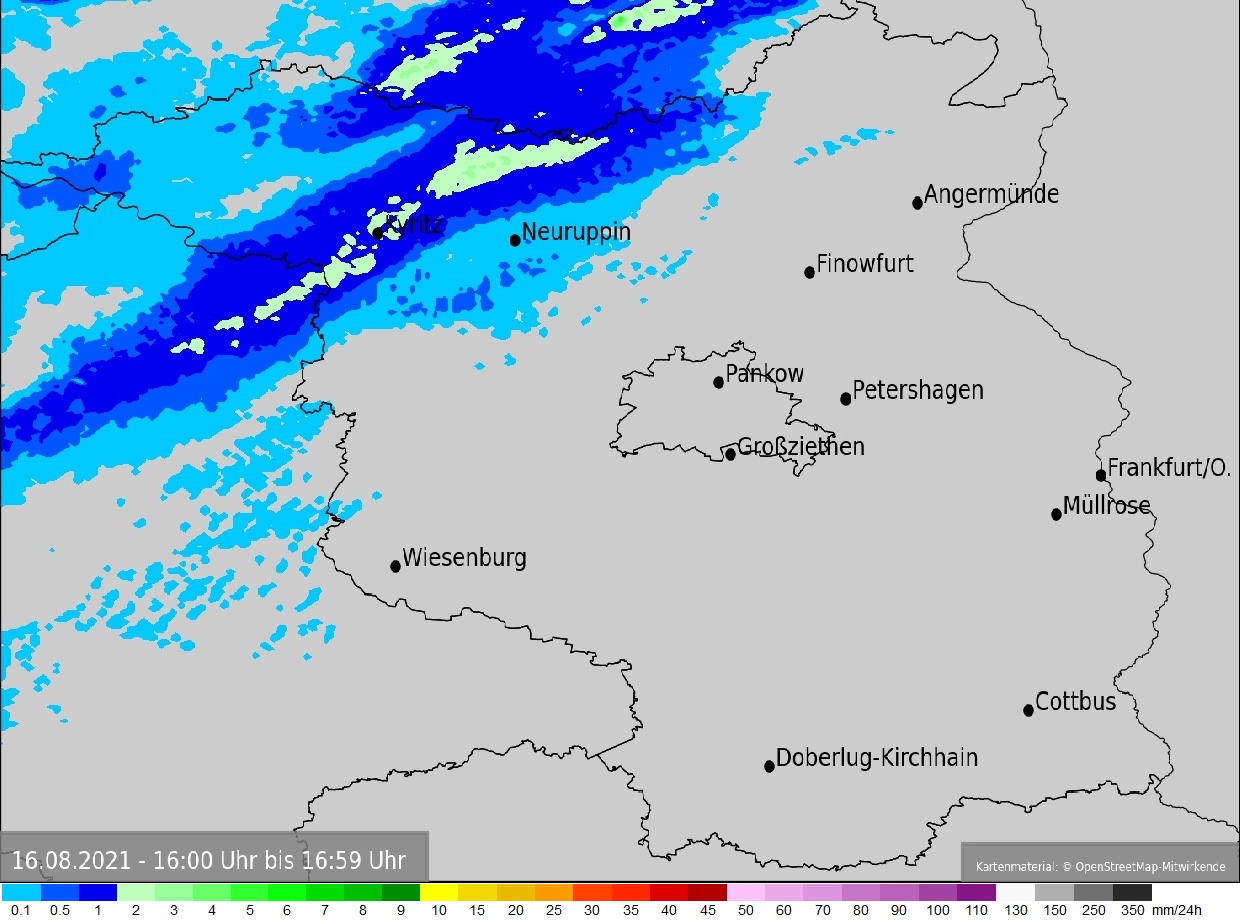
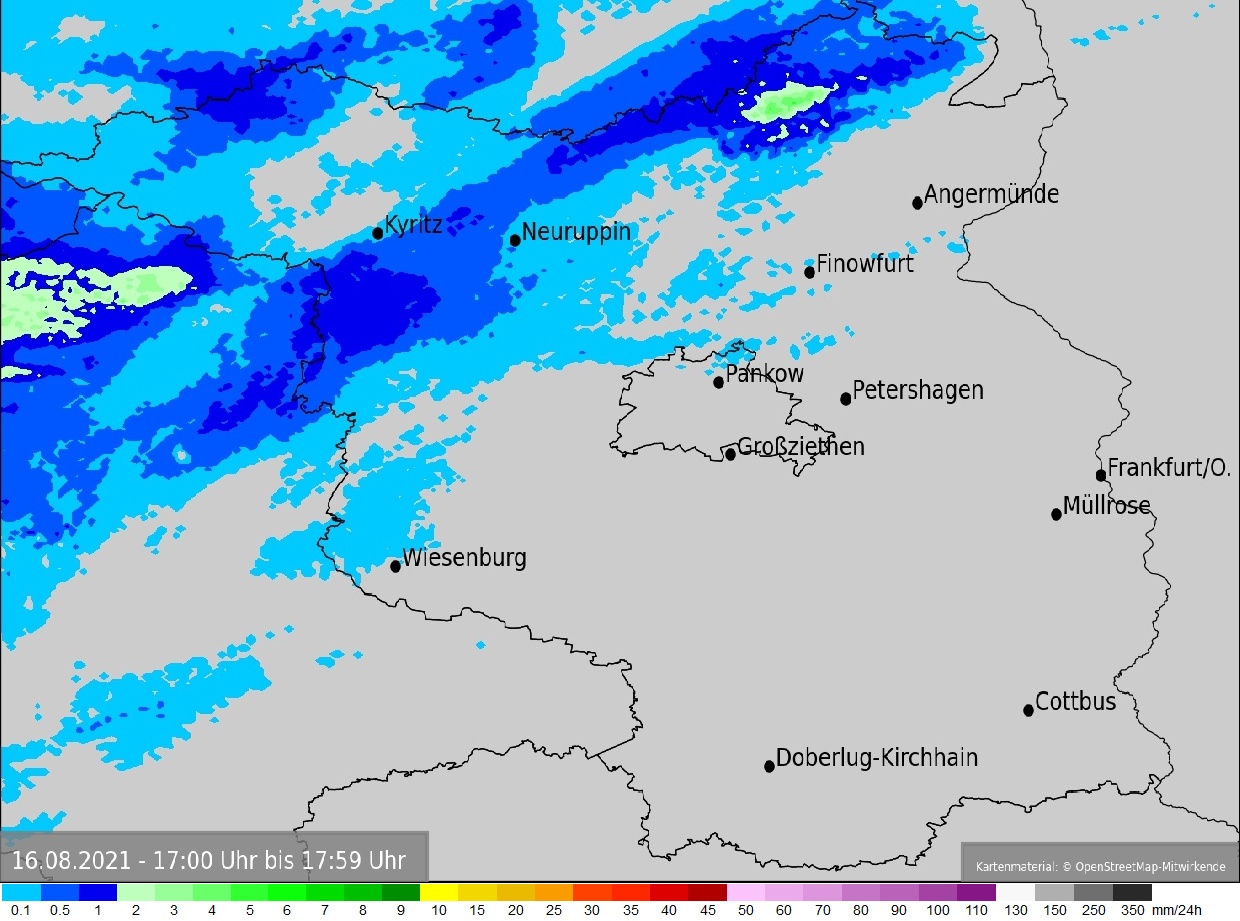
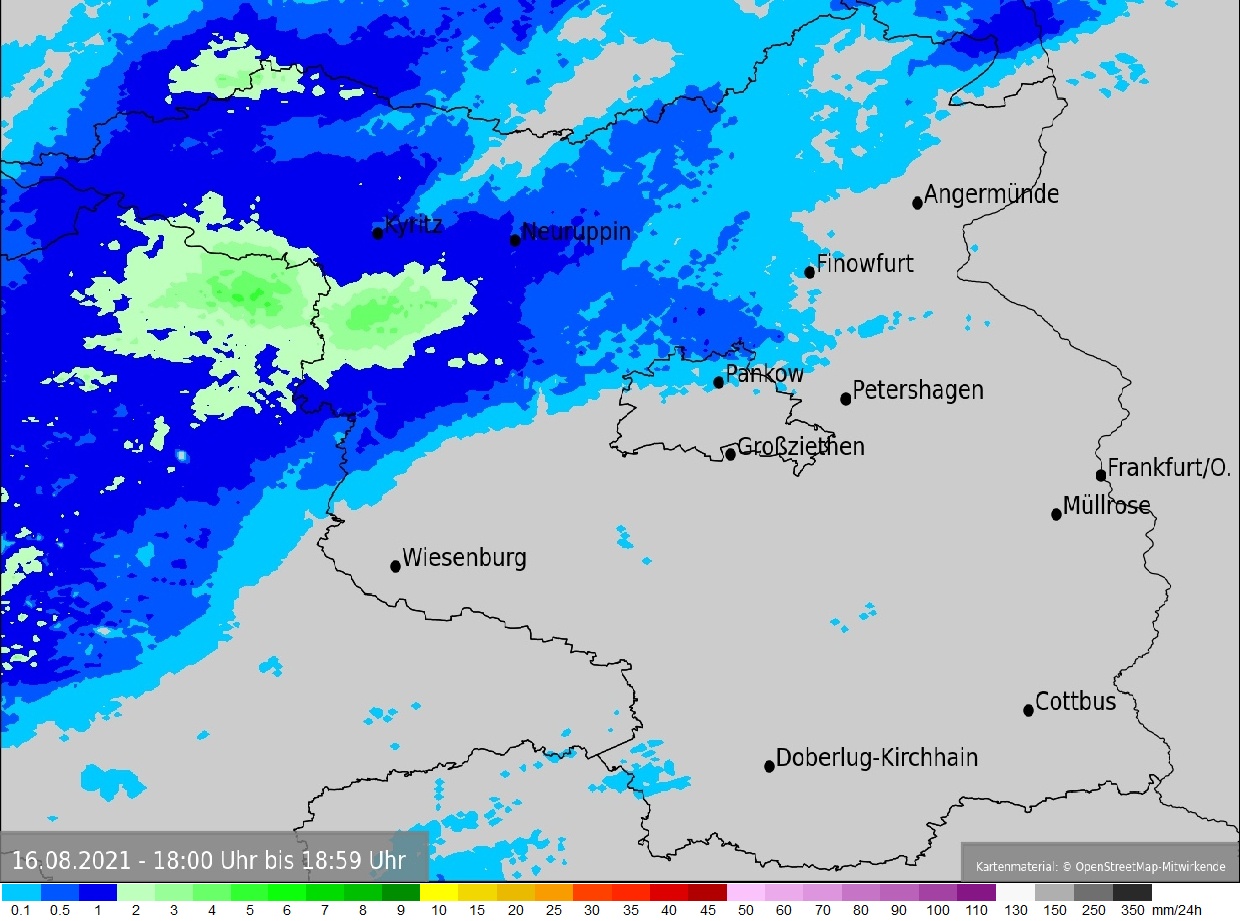
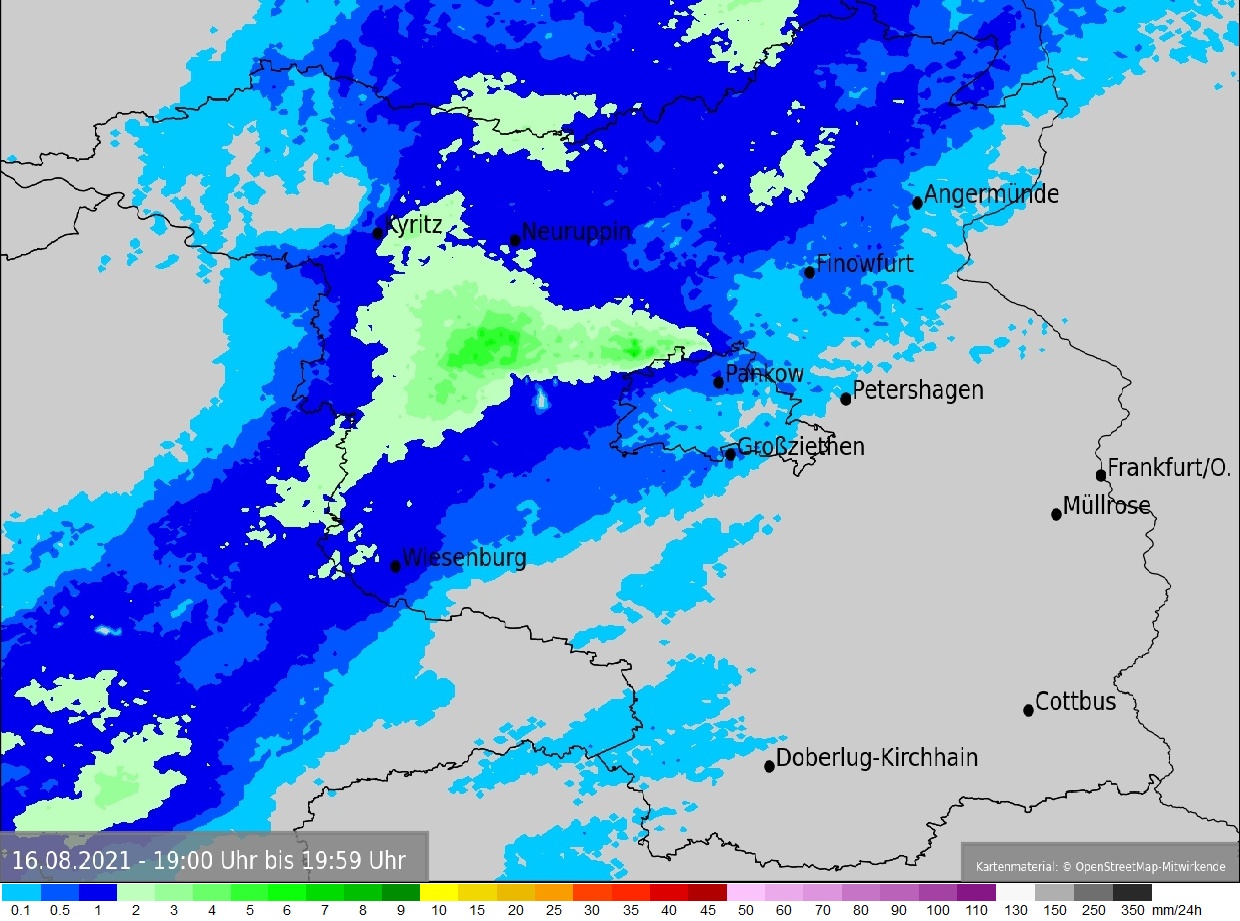
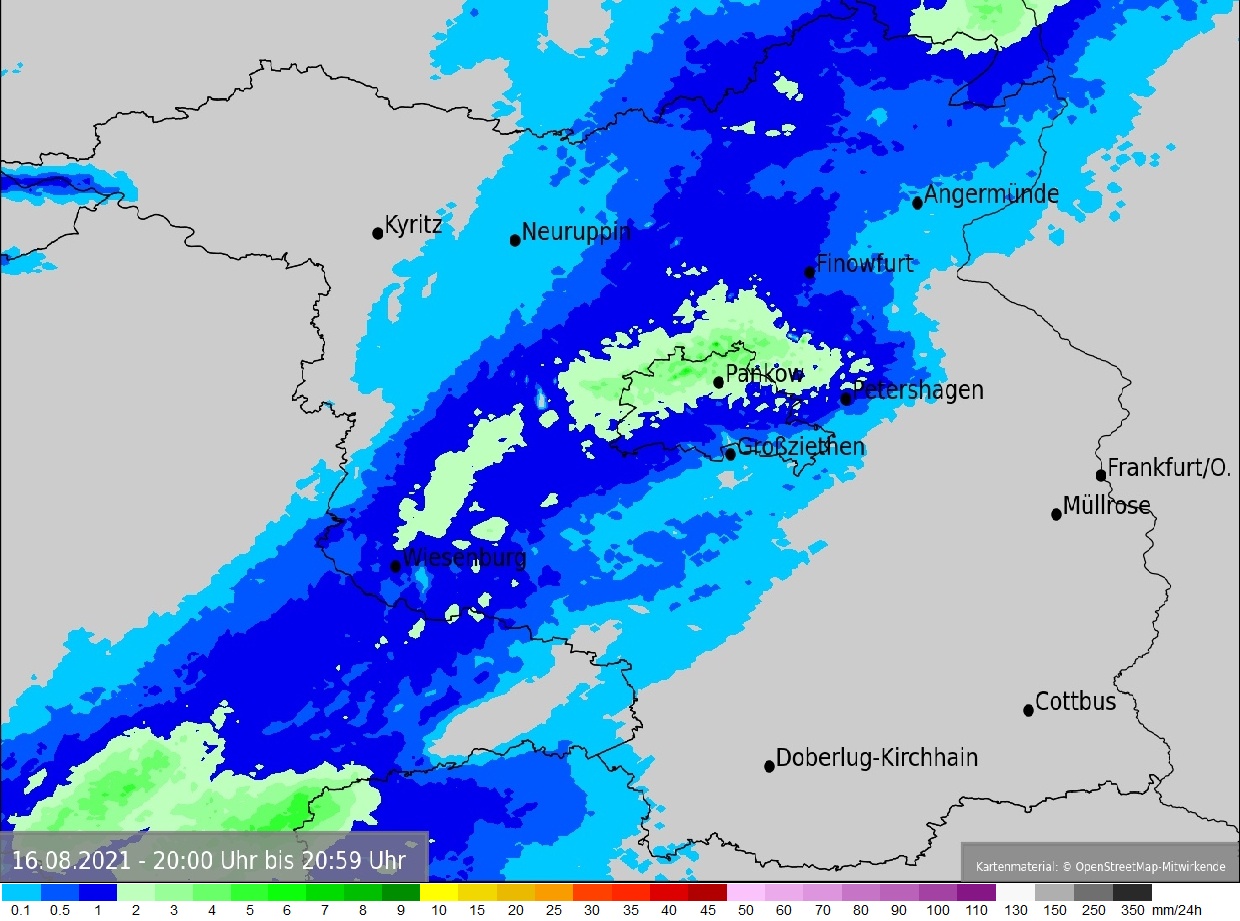
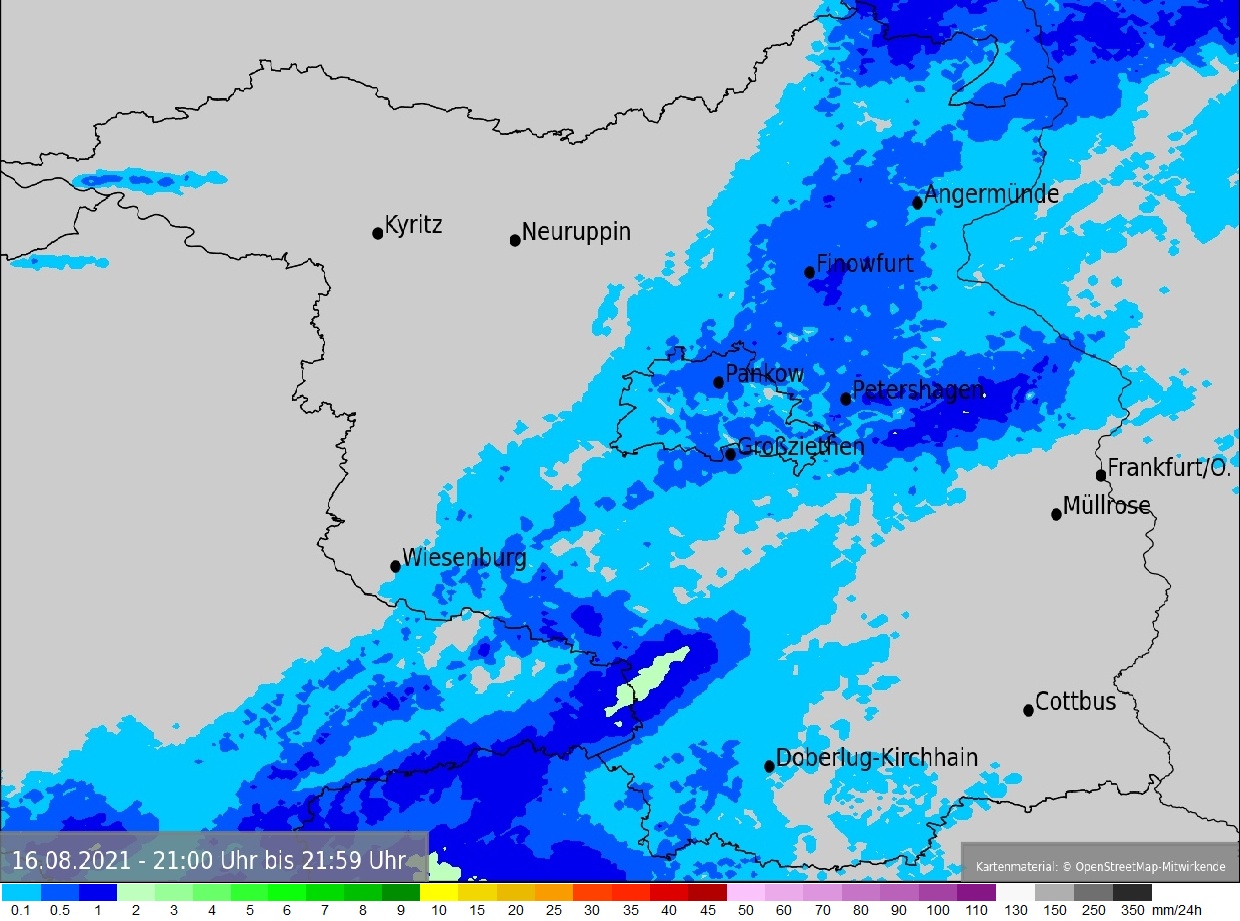
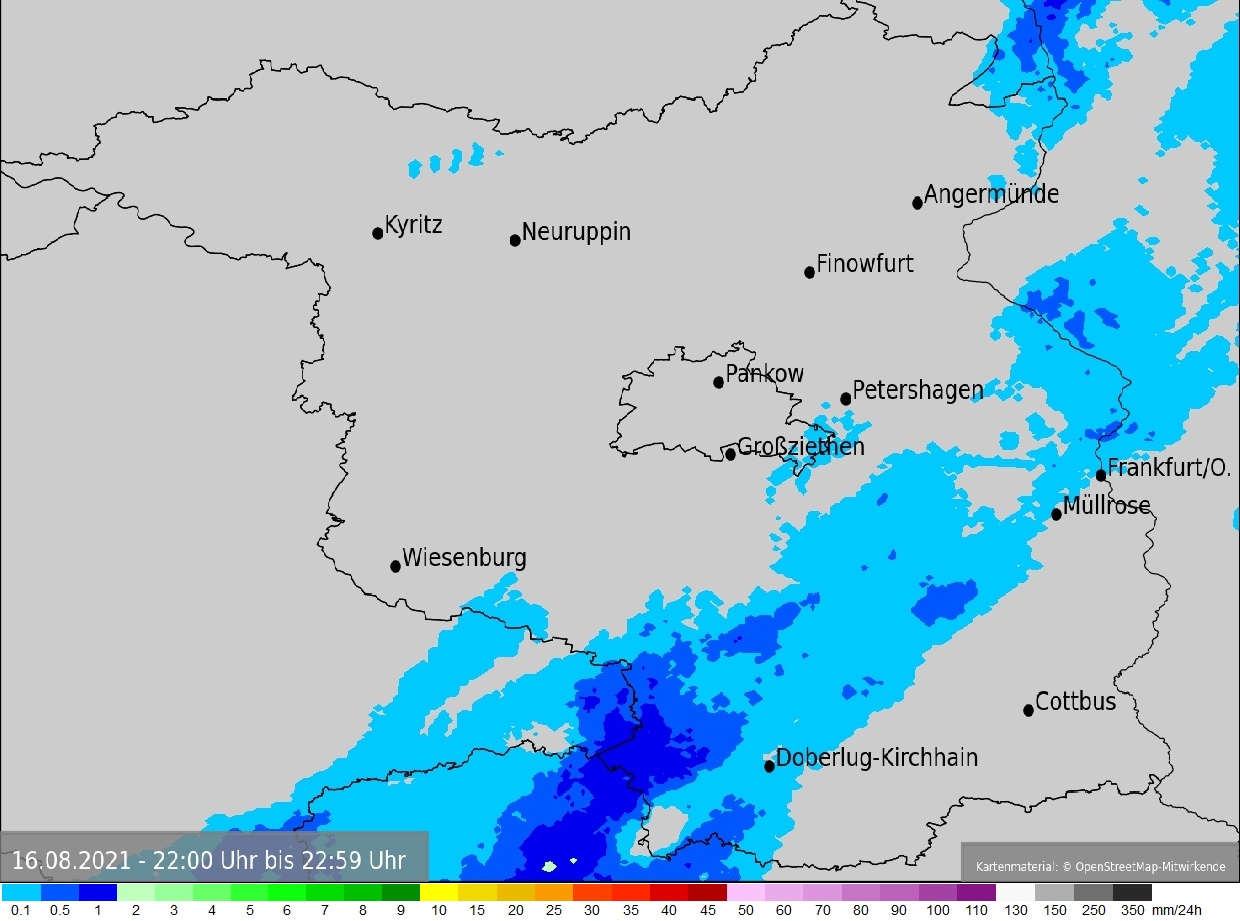
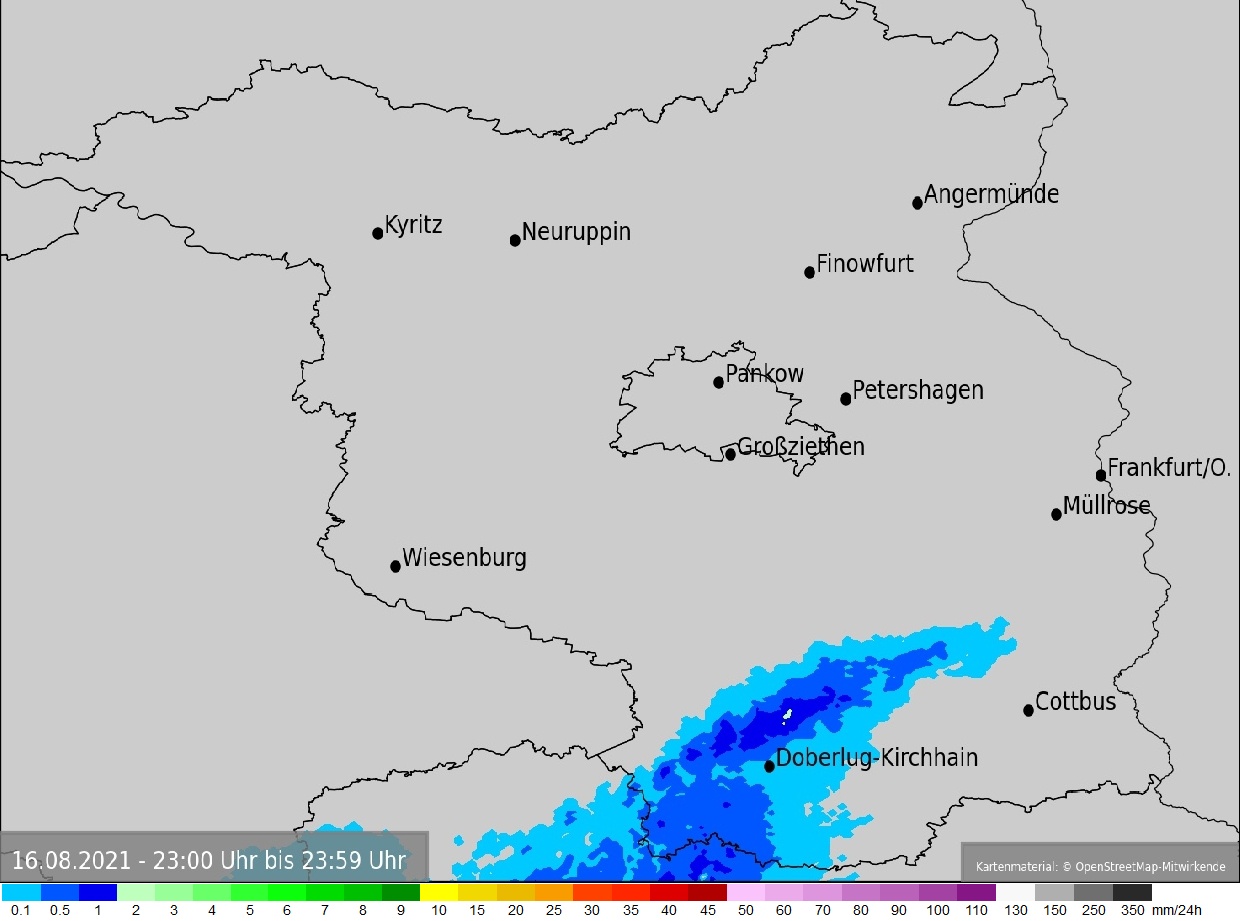
0.0 | 0.0 | 0.0 | 0.0 | 0.0 | 0.0 | 1.2 | 0.0 | 0.0 | 0.0 | 0.0 | 0.0 | 0.0 | 0.0 | 0.0 | 0.0 | 0.0 | 0.0 | 0.2 | 0.4 | 0.8 | 0.6 | 0.0 | 0.0 |
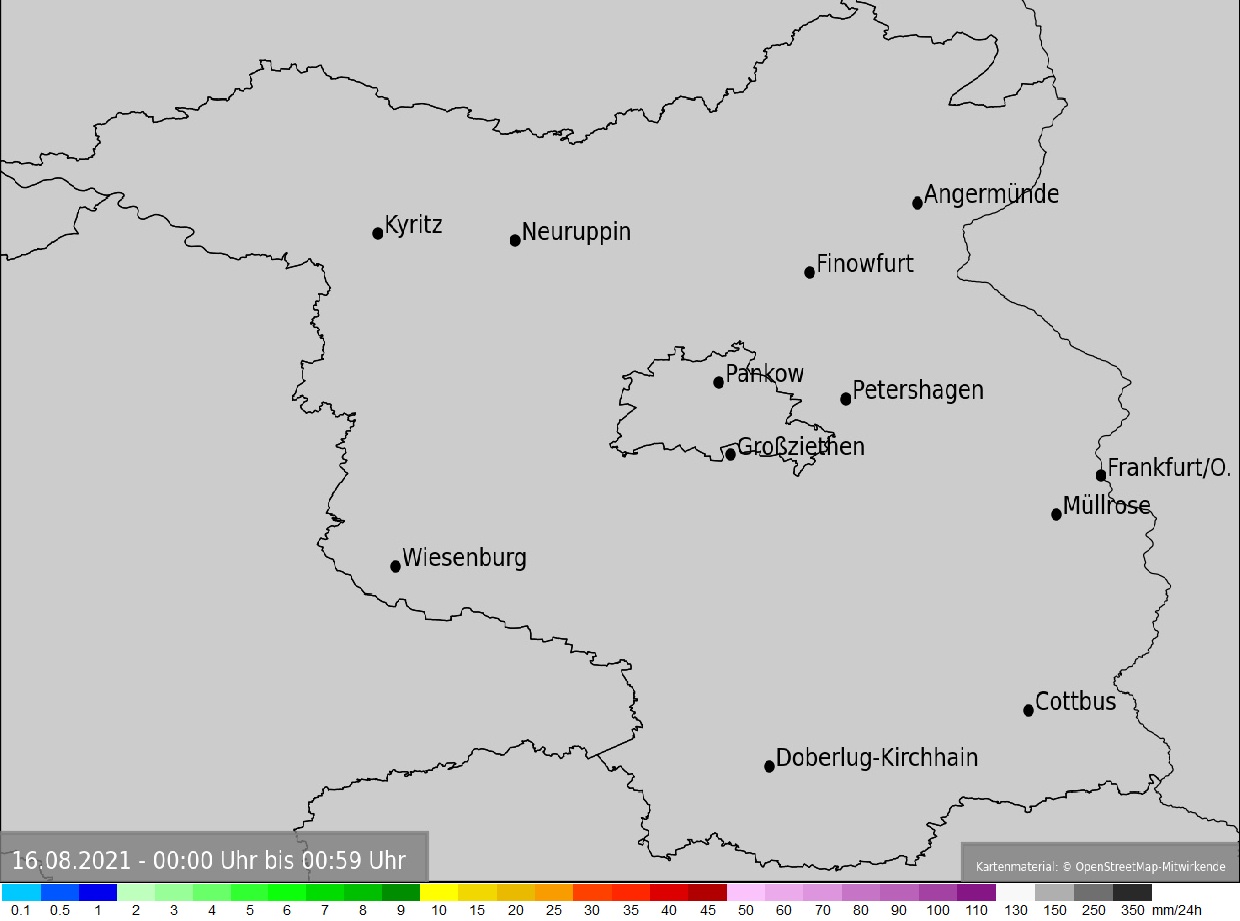
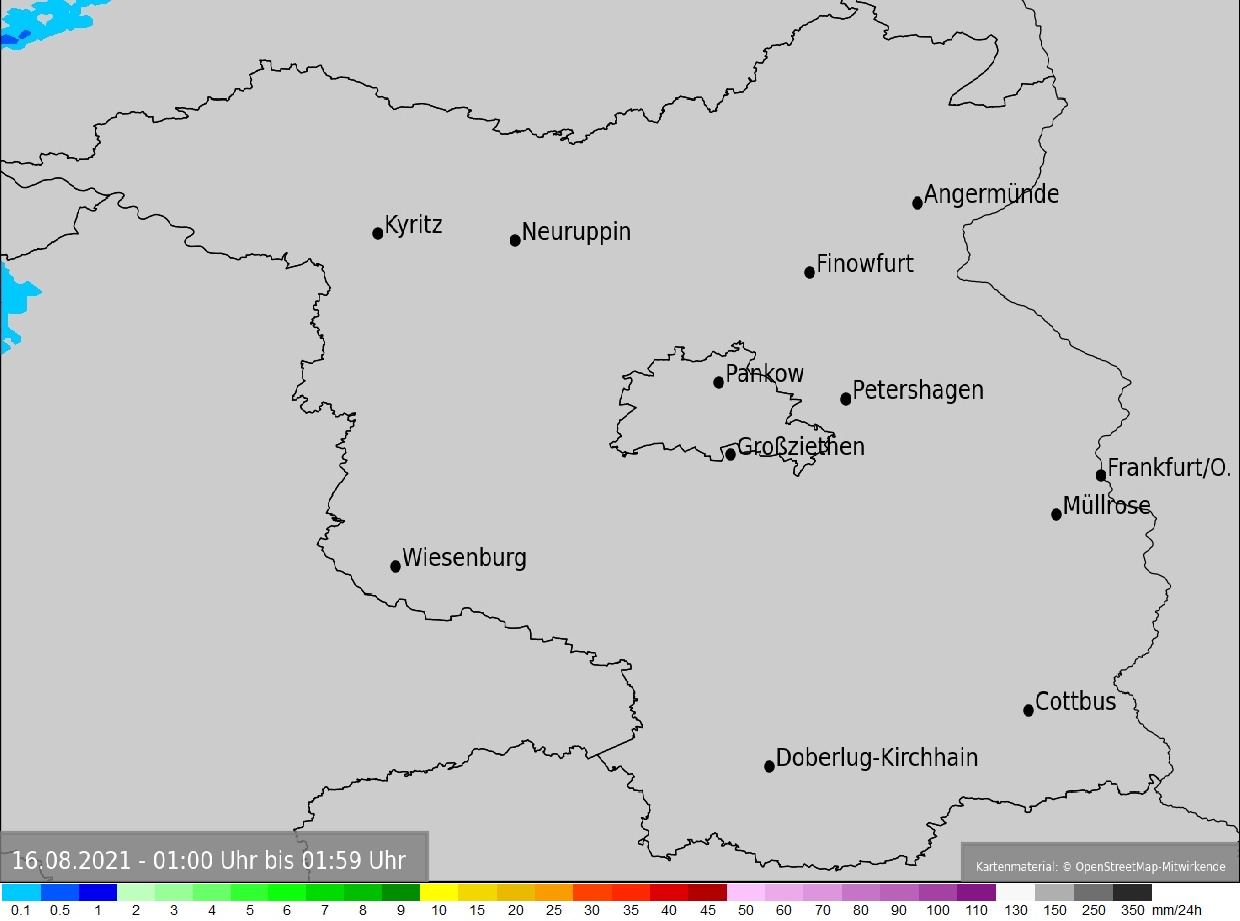
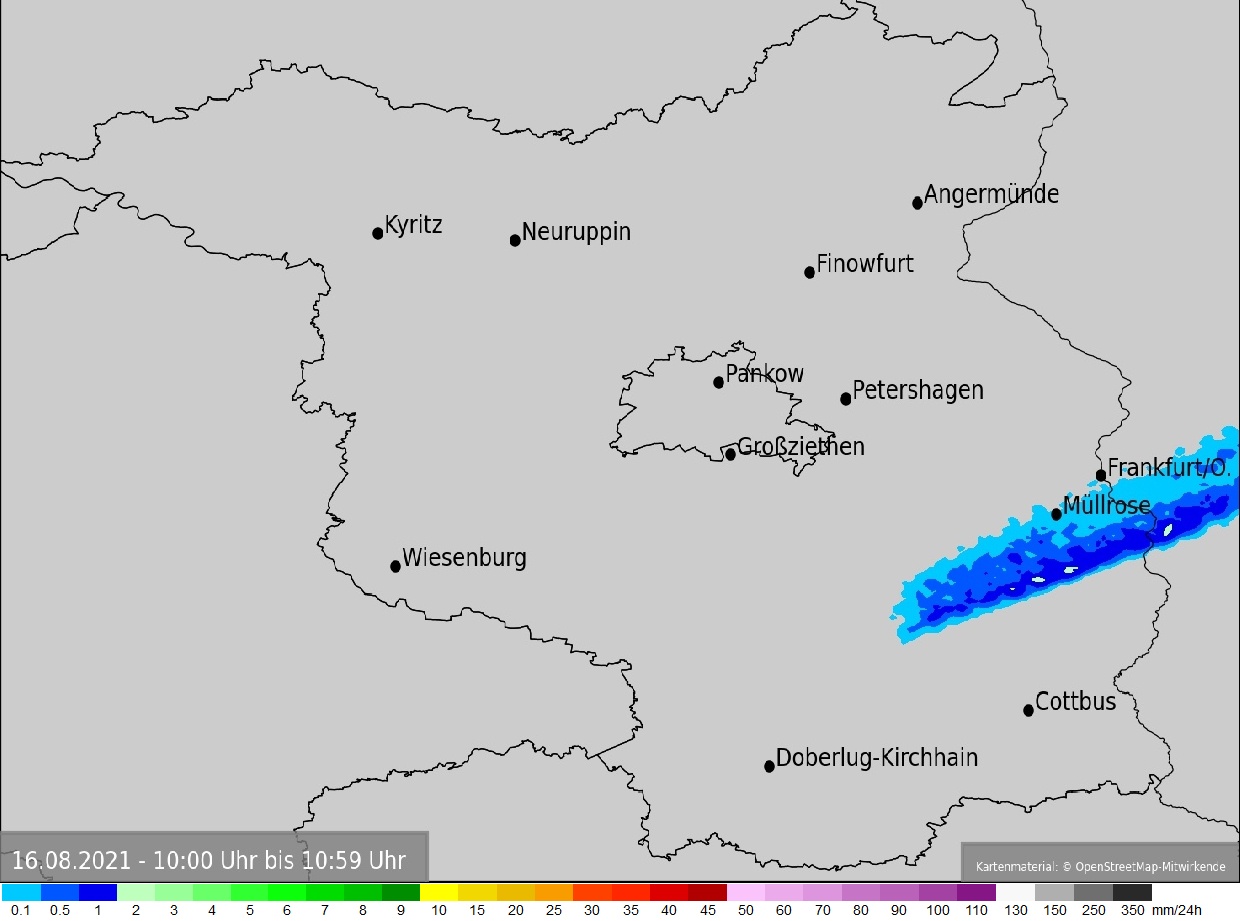
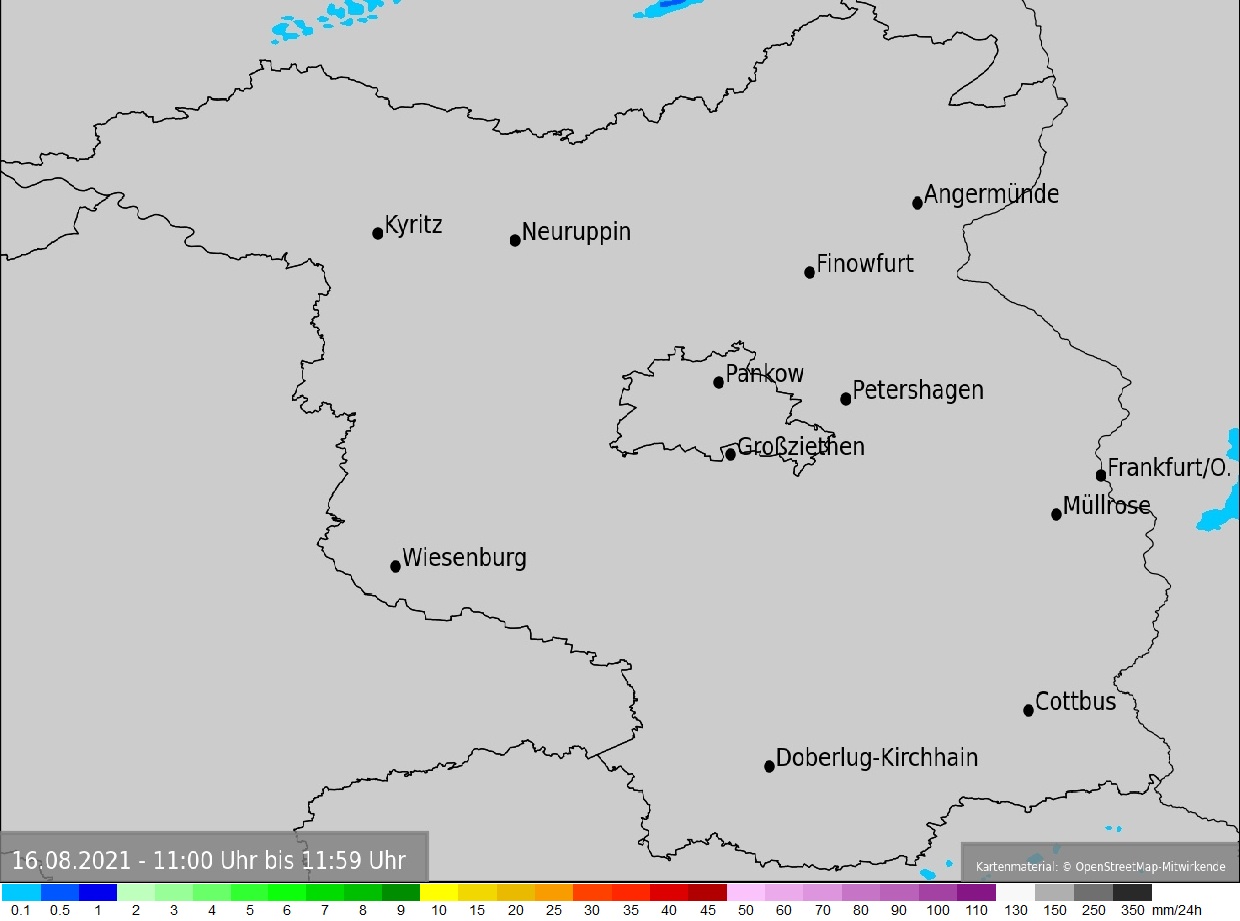
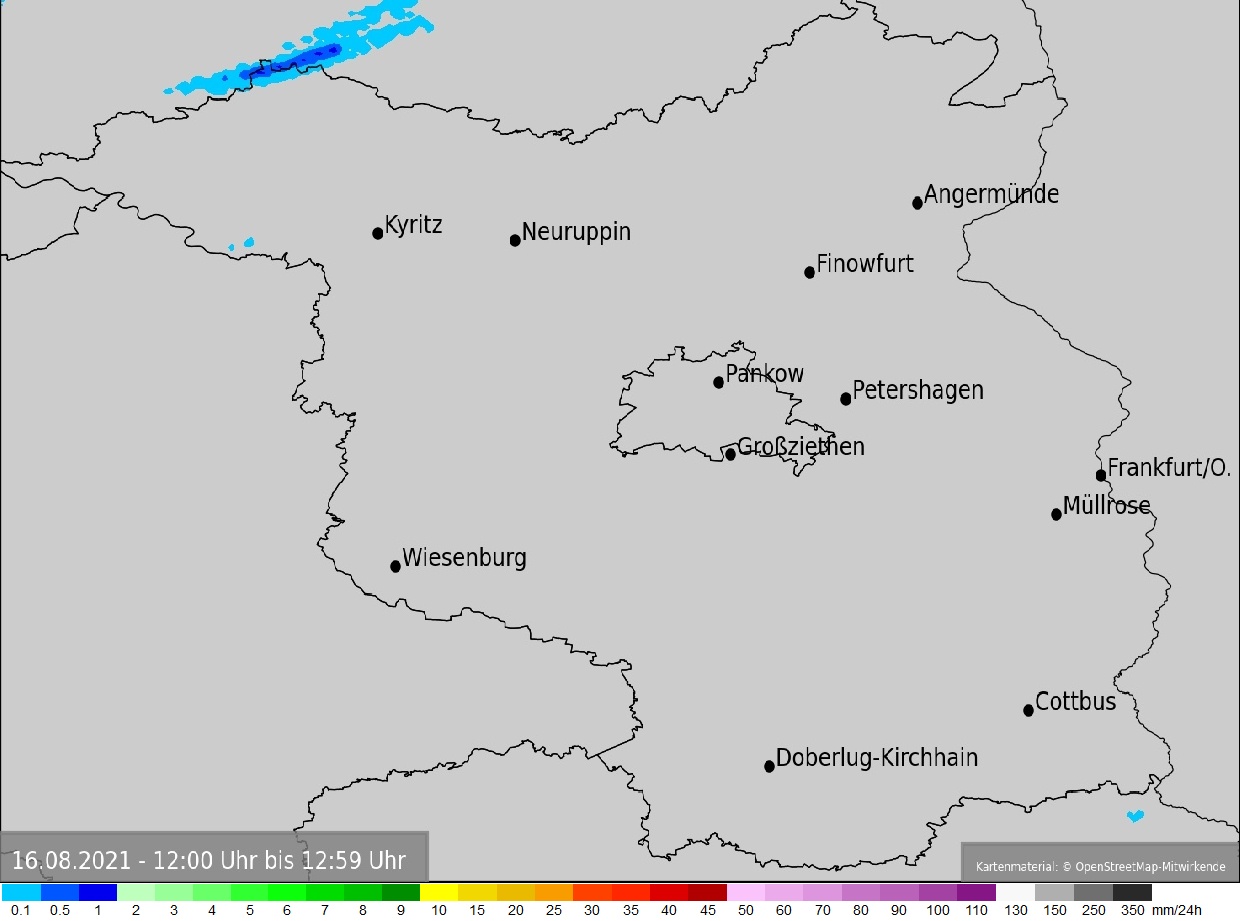
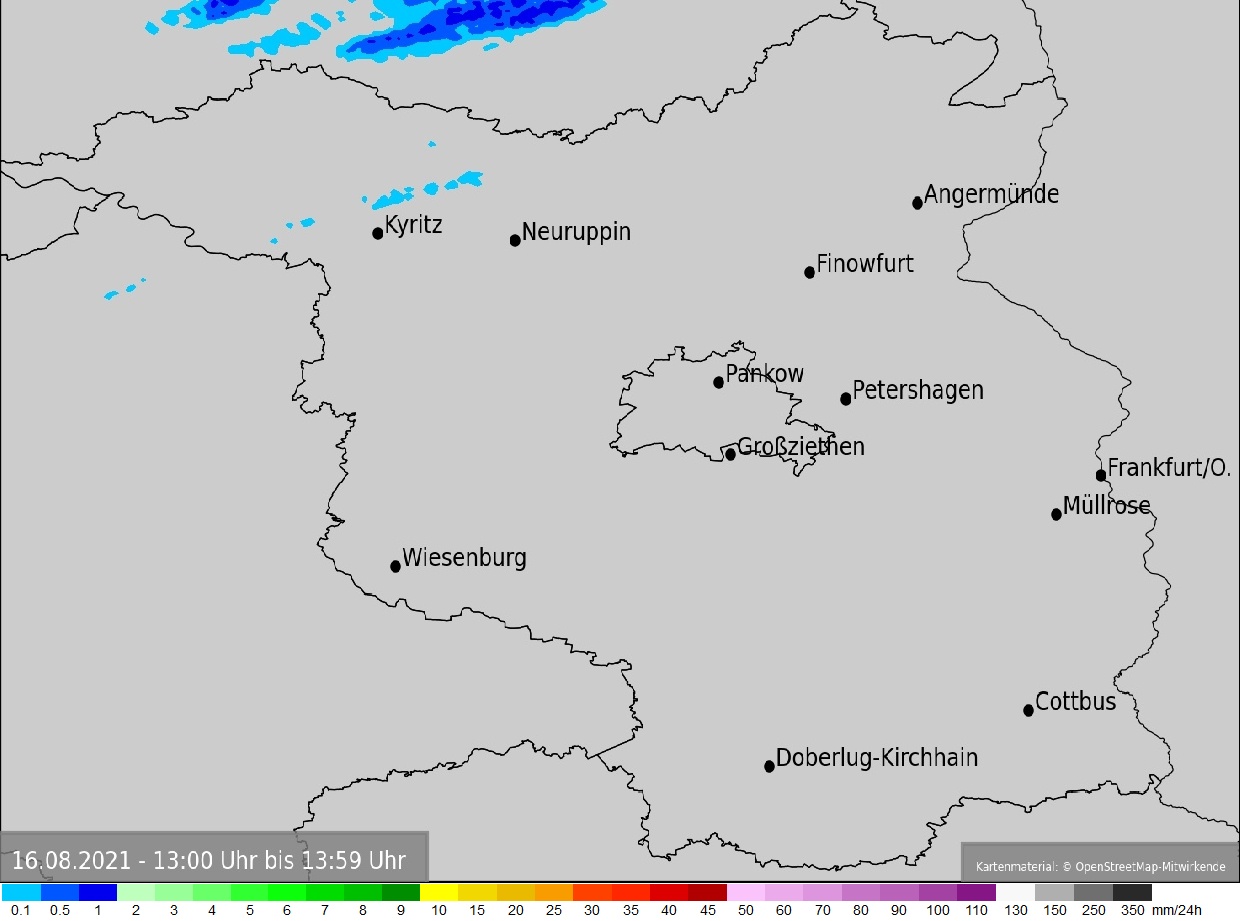
| Summenkarte vorhanden? |
Ja | Ja | Ja | Ja | Ja | Ja | Ja | Ja | Ja | Ja | Ja | Ja | Ja | Ja | Ja | Ja | Ja | Ja | Ja | Ja | Ja | Ja | Ja | Ja |
| Stunde → | 00 | 01 | 02 | 03 | 04 | 05 | 06 | 07 | 08 | 09 | 10 | 11 | 12 | 13 | 14 | 15 | 16 | 17 | 18 | 19 | 20 | 21 | 22 | 23 |
|---|---|---|---|---|---|---|---|---|---|---|---|---|---|---|---|---|---|---|---|---|---|---|---|---|
| Windrichtung | ||||||||||||||||||||||||
| Wind (Ø) in km/h |
0.0 | 0.2 | 0.0 | 0.1 | 0.4 | 0.6 | 3.3 | 1.0 | 1.9 | 5.4 | 8.7 | 12.7 | 14.0 | 10.1 | 11.8 | 8.4 | 11.3 | 14.5 | 11.9 | 4.5 | 7.4 | 5.3 | 6.8 | 9.7 |
| Wind (Ø) in Bft |
0 | 0 | 0 | 0 | 0 | 0 | 1 | 0 | 0 | 1 | 2 | 2 | 3 | 2 | 2 | 2 | 2 | 3 | 2 | 1 | 2 | 1 | 1 | 2 |
| Windböe (max.) in km/h |
0.0 | 3.2 | 1.6 | 3.2 | 3.2 | 3.2 | 25.7 | 4.8 | 9.7 | 14.5 | 29.0 | 32.2 | 30.6 | 30.6 | 27.4 | 22.5 | 29.0 | 43.5 | 33.8 | 16.1 | 20.9 | 12.9 | 16.1 | 24.1 |
| Windböe (max.) in Bft |
0 | 1 | 0 | 1 | 1 | 1 | 4 | 1 | 2 | 3 | 4 | 5 | 5 | 5 | 4 | 4 | 4 | 6 | 5 | 3 | 4 | 2 | 3 | 4 |
| Sonnenscheind. in Minuten |
0 | 0 | 0 | 0 | 0 | 0 | 7 | 16 | 60 | 60 | 43 | 46 | 34 | 36 | 23 | 12 | 4 | 0 | 0 | 0 | 0 | 0 | 0 | 0 |
| Solar in W/m² |
0 | 0 | 0 | 0 | 0 | 0 | 8 | 37 | 219 | 371 | 552 | 640 | 603 | 172 | 203 | 206 | 167 | 128 | 38 | 25 | 0 | 0 | 0 | 0 |
| Taupunkt in °C |
13.9 | 13.5 | 13.0 | 12.4 | 12.6 | 12.4 | 12.1 | 13.4 | 15.0 | 16.4 | 16.4 | 15.9 | 13.6 | 13.9 | 14.8 | 14.0 | 13.0 | 12.9 | 14.4 | 12.4 | 12.6 | 12.2 | 11.3 | 11.5 |
Finowfurt - Warnindizes vom 16.08.2021
| Stunde → | 00 | 01 | 02 | 03 | 04 | 05 | 06 | 07 | 08 | 09 | 10 | 11 | 12 | 13 | 14 | 15 | 16 | 17 | 18 | 19 | 20 | 21 | 22 | 23 |
|---|---|---|---|---|---|---|---|---|---|---|---|---|---|---|---|---|---|---|---|---|---|---|---|---|
| UV-Index | 0.0 | 0.0 | 0.0 | 0.0 | 0.0 | 0.0 | 0.0 | 0.0 | 0.7 | 1.5 | 2.6 | 2.9 | 4.9 | 2.4 | 1.6 | 1.5 | 1.2 | 0.7 | 0.0 | 0.0 | 0.0 | 0.0 | 0.0 | 0.0 |